The 2014 humpback whale season in Tonga was for me, in a word, incredible. The best I’ve experienced to date.
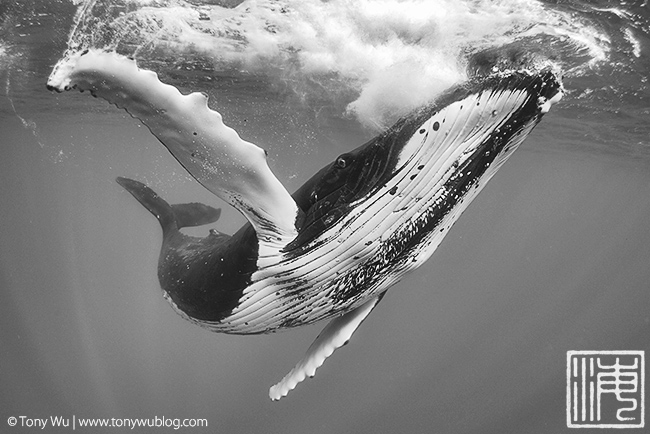
Between 6 August and 25 September, I spent a total of 33 days on the water. During that time, I saw more activity than I can ever recall experiencing, characterised early on by a dense concentration of humpbacks in the inner waterways of the Vava’u island group.
There were so many whales in fact, that for the first week+ of my stay, I was unable to make it to open water outside the islands, as whales popped up all over the place, one after another, making it impossible to go too far.
Whales entered Neiafu harbour several times, twice that I saw: A six-whale heat run on 24 August that did an entire circuit of the harbour in the early AM, and a female with calf on 27 August. I know there were other occasions as well. While the presence of whales inside the harbour isn’t unprecedented (I’ve seen them there before), it’s certainly not a common occurrence, and it’s not something that one generally expects to take place several times in a season.
My calf count statistics for this season underscore just how exceptional the season was.
My calves ID-ed/ boat-day ratio, for instance, skyrocketed…
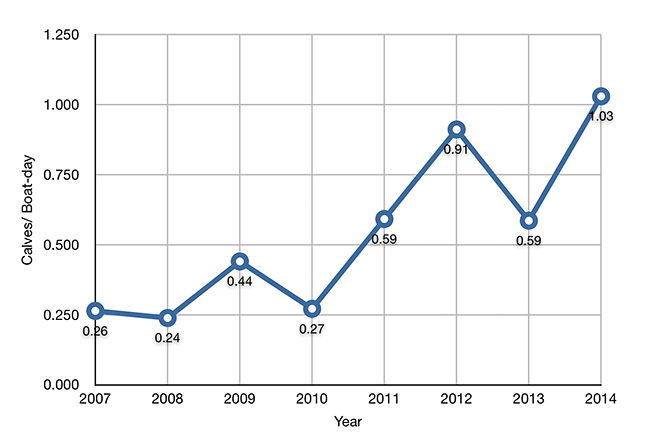
…with the total calves sighted (those ID-ed + not ID-ed)/ boat-day underscoring this point:
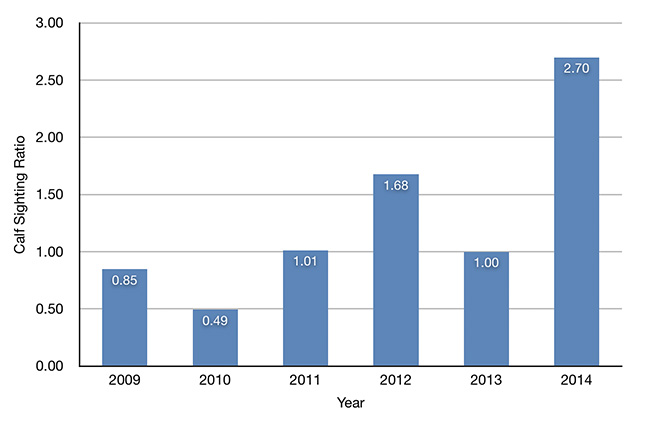
A breakdown of the above graph highlights the relative proportions of ID-ed to not ID-ed calves:
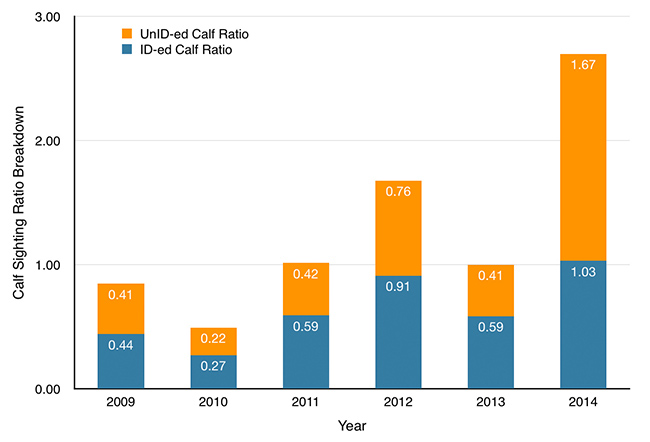
One thing that emerges from the above breakdown is the high proportion of calves I was unable to ID this season. For the first time since I started recording this data, the number of calves I wasn’t able to ID exceeded those that I could ID.
"So what?" you might wonder.
Well...what this seems to highlight is that when the density of whales is exceptionally high, there is an upper limit to how many calves I can feasibly ID on a given day. Besides good luck and conducive weather, it takes time and patience to find and work with mother/ calf pairs that will permit in-water photos to be taken.
In a season when the density of whales substantially exceeds my time-constrained ability on any given day to photo-document calves in the water, there will be many mother/ calf pairs that I see, but am unable to spend time with.
In practice this year, this manifested many times as spotting one or more mother/ calf pairs within visual range while my friends and I were already spending time with other whales. In other words, the humpbacks overwhelmed us!
Any way you slice the data, it’s clear that the figures for this year blow away past totals.
One could certainly critique the above graphs by pointing out that I haven’t conducted consistent transects each season.
It is impossible to do so however, as prevailing wind and water conditions dictate where and when it’s safe to go on any given day. Within the constraints imposed by Mother Nature, I’ve done my best to keep the methodology as consistent as possible.
Sample size also comes into play. Small sample sizes taken during short periods of time increase the possibility for distortion. Large sample sets observed over extended periods of time in the same place, at approximately the same time each season, tend to smooth out random deviation.
My system isn’t perfect, but with hundreds of days of data represented in the graphs above, I’m confident the trends reflect reality.
One factor I think worth highlighting is variance across time.
Specifically, during the early part of the season, there were many humpback whales around, with a high concentration in the inner waterways of the islands comprising Vava’u. As the season progressed, the whales tended to thin out and move outside.
This trend makes sense and happens each season, but perhaps due to the unusually high concentration of whales this year, the shift seemed abrupt and more noticeable than normal.
To help illustrate this point, here is a graph of calf IDs and sightings over time, with the blue being the number of calf IDs, and the orange representing sightings of calves that I couldn’t ID:
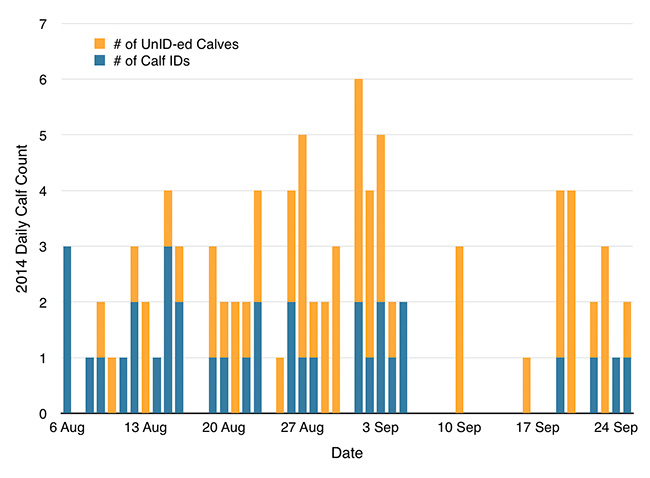
Early in the season, I had many two- and three-calf ID days. Also, I was marking calves I couldn’t ID because I was busy with other whales, including many repeat encounters with mother/ calf pairs previously ID-ed. Toward the latter part of the season, I had to work hard for single-ID days, and I was marking not-ID-able calves mostly because they were not easy to approach and traveling more often in open waters outside the protected inner areas.
You'll probably notice that there is a hole in the data for the middle of September (specifically, 6-15 September). I was on the water during much of that time, but I did not have 100% control over the boat I was on during most days over that period. As a result, I did not include data for the days when I was unable to apply consistent methodology.
The data gap isn't ideal, as there was definitely a marked change in whale number and mood during that period.
It’s tough to state an exact date, but I first felt the shift on 12 September, and I was pretty certain I wasn’t imagining things by 15 September.
For instance, while my first group of friends were with me in the early part of the season, I ID-ed eight calves, had six repeat encounters with calves I had previously ID-ed, and had five calves I couldn’t ID. While my last group of friends who visited this season were with me, I ID-ed four calves, had one repeat encounter, and came across 12 calves I couldn’t ID. Both groups were on the water for the same amount of time.
The next graph complements the one above. It plots the changes in my calf/ boat-day ratio and calf sighting ratio over time.
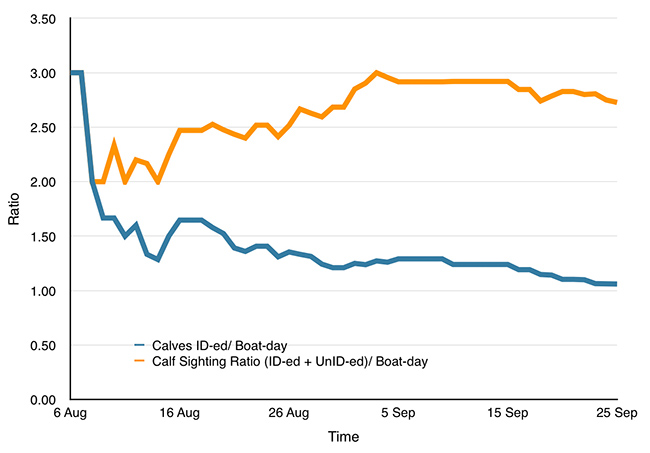
As you can see, if I had only taken a sample of a week or two early in the season, my calves/ boat-day ratio would have been higher than I ended up with. Conversely, if I had only been present during the latter part of the season, my data would not have captured the high whale density, activity, and interactiveness in the earlier part of the season.
This underscores the importance of having a substantial sample size, and by reading between the graph lines, you can see evidence of what I stated above: that I experienced many encounters with receptive mother/ calf pairs early in the season (hence the relatively high calves/ boat-day ratio). Over time, the two lines diverge. The increasing orange line, which shows the total of ID-ed + not ID-ed calves, increases. The blue line, which shows calf IDs, drops.
This supports my statement that as the season progessed, there was a decline in encounters with friendly mother/ calf pairs (due to movement to outer waters that required more travel/ search time, and generally lower receptiveness to encounters); while the lack of significant decline in the orange line shows that the concentration of mother/ calf pairs remained high throughout the season. It just became more difficult to establish in-water photo IDs as time went by.
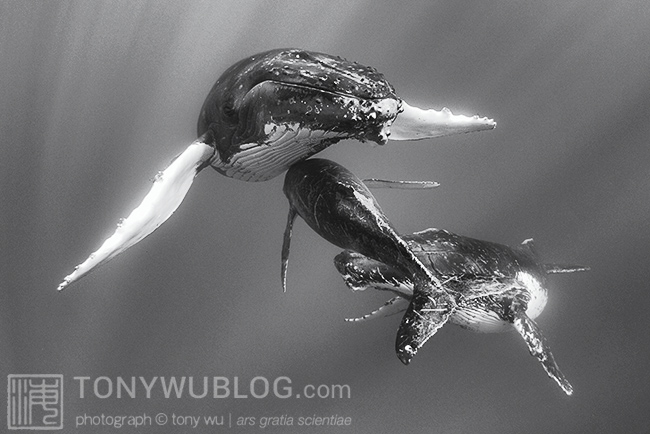
For what it’s worth, I’ve received reports that the whales have come back and have become somewhat more interactive again since I left the area. There was, in fact, a heat run yesterday!
Of the calves for which I was able to determine gender, males outnumbered females this season.
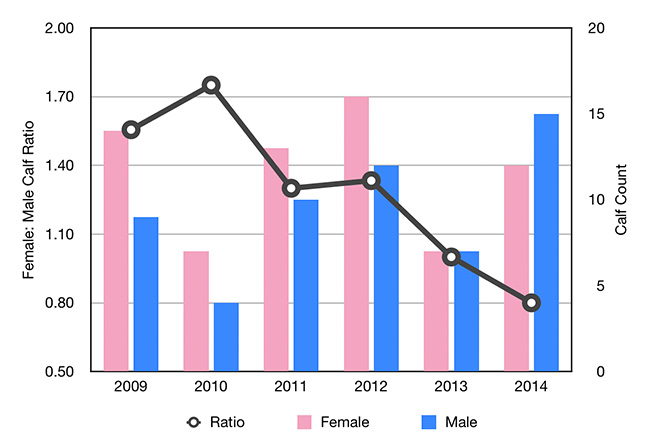
Meki, one of the captains I work with, has been rooting for the boys to win for several seasons now. He finally got his wish!
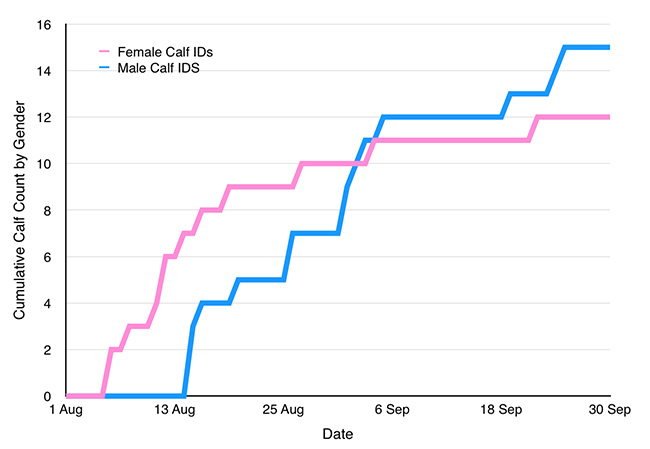
Female calf IDs dominated the first part of the season; the males came on strong at the end. I’m not sure if there’s any value in tracking the gender breakdown, but it’s fun to do.
My escort data shows something interesting.
I first started recording data on escorts in 2011. The ratios declined from 2011 to 2013. This year, they all popped back up.
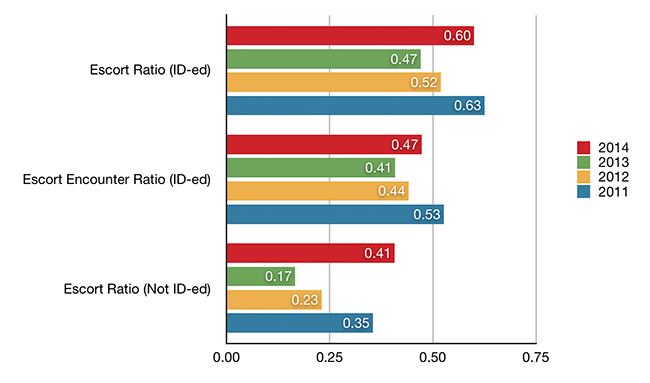
(Escort Ratio = ratio of mother/ calf pairs that had escort(s) during at least one encounter to total ID-ed mother/ calf pairs. Escort Encounter Ratio = ratio of encounters that included at least one escort to the total number of encounters with ID-ed mother/ calf pairs).
I’m not sure what, if any significance this might have, but one possibility is that there could have been a relative dearth of single females this season. In other words, these ratios might indicate a cycling of the proportion of eligible single females across seasons. The increase could also possibly reflect a plethora of male visitors to the area this year. Or...the bounce-back in escort ratios might just be a fluke (oh ouch, such a bad pun) and mean nothing at all. I guess I’ll have to keep recording data to see if a pattern emerges.
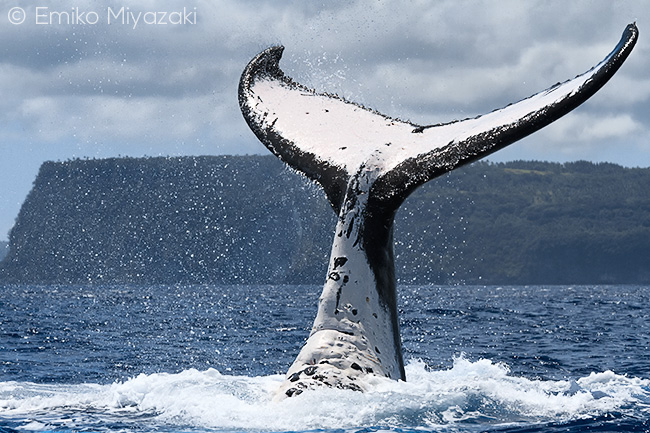
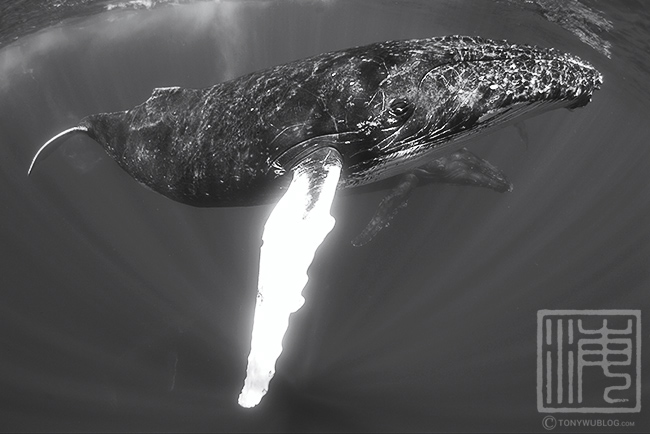
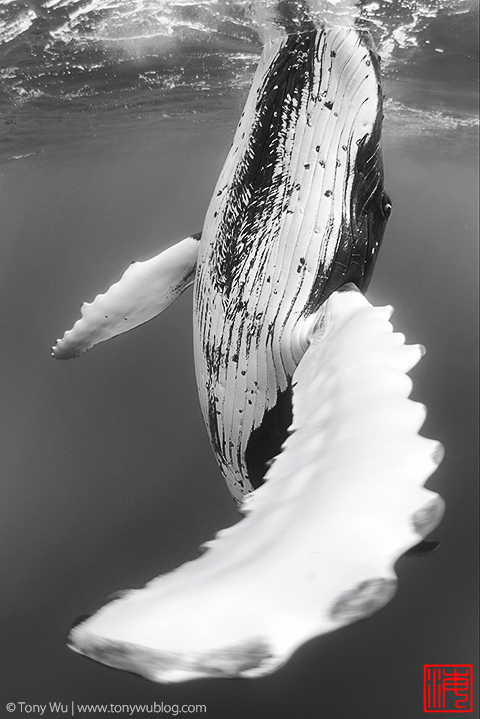
Other things of note include the fact that there were many, many heat runs, 18 that I saw (see photos in Part 3 and Part 6). There were also a lot of whales with easily recognisable patterns, including somewhere between eight and 16 whales that I saw with all-white pectoral fins like this…
…and five whales that I documented with split/ unique dorsal fins:
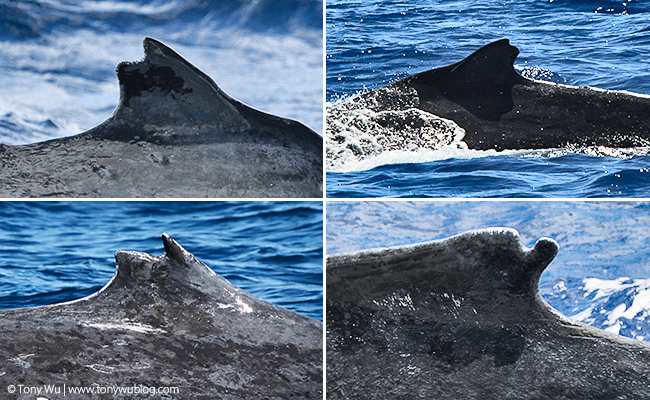
Whales like these interest me because (a) they are easy to spot and remember, and (b) they don’t appear in great numbers every season. For instance, my previous high for white pectoral fins was 21 in 2012, which was the most action-packed season until this year.
As if to flaunt their prevalence this season, a pair of whales showed up on 25 August (both probably male). One had white pectoral fins; the other had a split dorsal fin! To me, that’s like hitting 777 twice in a row in Vegas.
Though baleen whales in general and humpbacks specifically are not known to travel in related groups (the way toothed cetaceans like sperm whales do, for example), I’m inclined to wonder whether the occasional appearance of traits like this in large numbers indicates a relative genetic closeness among the relevant whales.
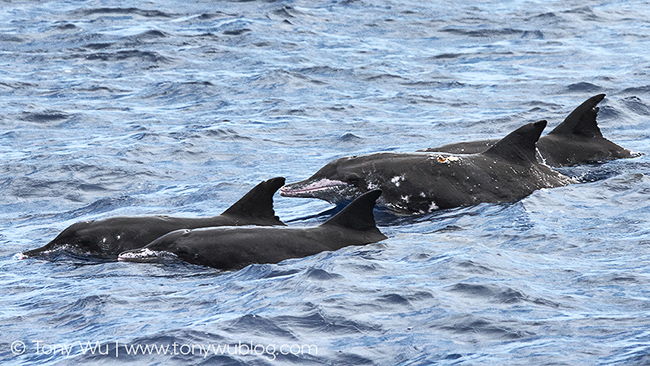
There were also some interesting non-humpback visitors. There was a dwarf minke whale early on (the same minke subspecies that shows up on the Great Barrier Reef each winter) and a couple of whale sharks that I know of. I saw what I believe was a single pygmy killer whale (Feresa attenuata), and I definitely saw a bunch of rough-toothed dolphins (Steno bredanensis).
Of course, all of this begs the question: “Why was there so much going on this season?”
And the answer is: “Who knows?!”
Perhaps reflecting near-El Niño conditions, both the water and air temperatures were substantially colder than normal. I spent most of August in a state of hypothermia.
Also, the area suffered from the worst drought I’ve seen. Many trees with fruits and seed pods pretty much gave up. Kapok trees (Ceiba pentandra) are excellent barometers of prevailing climate. The seed pods on the trees in Vava’u never matured this season, just dried up while green. First time I've seen that happen. This tells me that the drought this year was much worse than the one in 2012, which was already bad.
Whether any of this affected the whales or not, I don’t know. I’m happy that there were so many whales this season, and that the conditions were generally easy. And I’m hopeful that the abundance of humpbacks this season reflects ongoing strength in the recovery of the population.
I’m off again in a couple of days, so although I could ramble on for much longer, this will wrap up my humpback whale posts for this season.
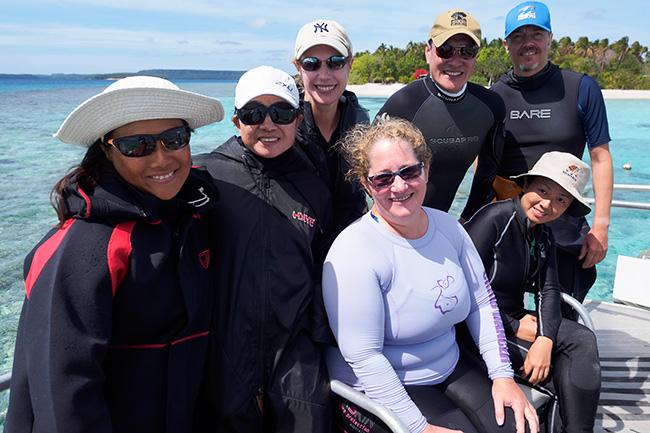
I’d like to close with a heartfelt “Thank you!” to everyone who traveled with me and made it possible for me to spend another season in Tonga recording data and taking photographs. The list of (very patient) people is long: Charlie, Krysia, Cassie, little Charlie, Kozyndan, Sara, Sue, Rinko, Keiko, Allyson, Rich, John, Fletcher, Michael, Ronda, Tony, Delisa, Alexandra, Justin, Nicholas, Laura, Heidi, Serene, Eck Meng, Indra, Gary.
Not to mention my wonderful friends in Tonga who made sure boats, crew, accommodations, meals and transport were always ready, and helped me to stomp out the inevitable crises that arose through the season. That’s no mean feat anywhere, but particularly meaningful in a remote location where parts, materials, ingredients, etc. are often in short supply.
My humpback whale trip schedule for 2015 is filling up quickly. If you’re game to subject yourself to my (only occasionally coherent) rambling, please send me a note via my contact form.
PS: Below is a map of my calf sightings this season if you’re interested. Note the distribution throughout the islands, especially the inner waterways. Yellow = ID-ed calves; red = not ID-ed calf sightings.
View Humpback Whale Calves, Tonga 2014 in a larger map
Related Posts:
Humpback Whales in Tonga 2014 | Part 1
Humpback Whales in Tonga 2014 | Part 2
Humpback Whales in Tonga 2014 | Part 3
Humpback Whales in Tonga 2014 | Part 4